In complex analysis the Riemann Sphere is a model of the extended complex plane. The extended complex plane being the union of the complex plane and infinity denoted as \( \mathbb{C} \cup \{ \infty \} \). The Riemann sphere is represented as the unit sphere sliced in half by the complex plane as shown below.
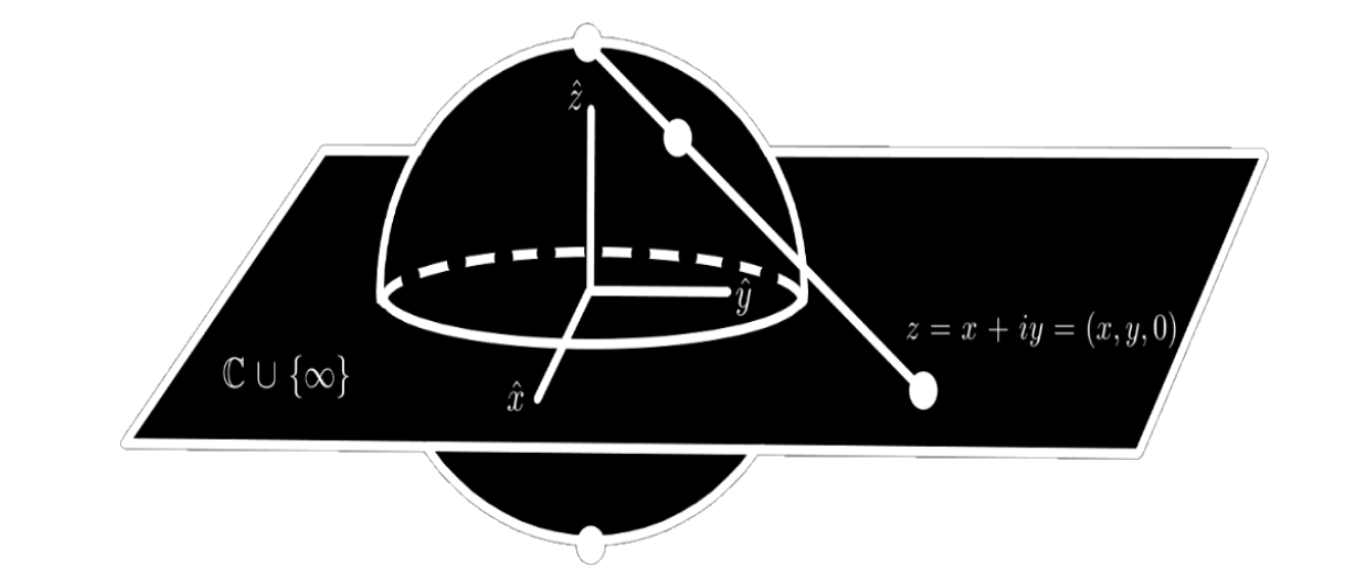
Every point on the complex plane (\(z = x + iy\)) can be mapped to a point on the sphere, this point is called
the stereographic projection of \(z\). The projection of the point can be found by drawing a line from the point
on the plane to the point on the North pole of the sphere (the point at \( \infty \)) with the coordinates
\((0,0,1)\). The projection on the sphere is where the line touches the sphere. It's possible to find exact equations for
the coordinates \( (x_1,x_2,x_3) \) of the projection for any point \( (x,y,0) \) on the complex plane as
\[ x_1 = Re(z) \frac{2}{|z|^2 +1 },\quad x_2 = Im(z) \frac{2}{|z|^2 + 1}, \quad x_3 = \frac{|z|^2 - 1}{|z|^2 + 1} .\]
Below is a simulator that demonstrates the relationship between functions
and their projections on the Riemann Sphere: